Whaaa . . . what!! Time for some more accountability/transparency!!
First, I want to remind you folks, that the three local site case study started out as a fully published and transparent case study, presented at SEO at The Beach, and I showed the URLs as well!!
Anyway, we finally have a bit of time under our belts, and some real data can start being looked at and shown. Remember, these sites didn’t really get started until Feb 15th!! So we are just two months in now.
Here you go, sites 1 through 3. Impressions and average position pulled from GSC. No, I will not do clicks because it’s a BS metric. Well not to say the metric itself is BS, but how Google reports it is. Meaning it’s not dependable.
Again, three local sites in the automotive niche all competing for the same keywords in the same location. The goal was, and still is, to cover most of page one for multiple keywords with our sites.
The keyword data in the following two images, is an aggregate of the three sites, not one of the individual sites.
Where Does Sank Stand Two Months In? The last data pulled for this is on 04/20/2024
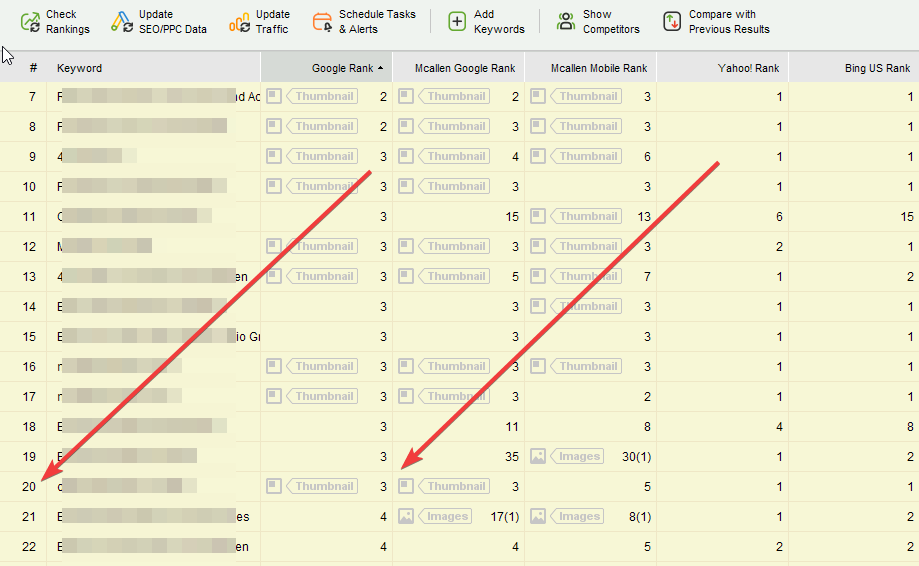
We have twenty keywords in positions 1-3 in Google.
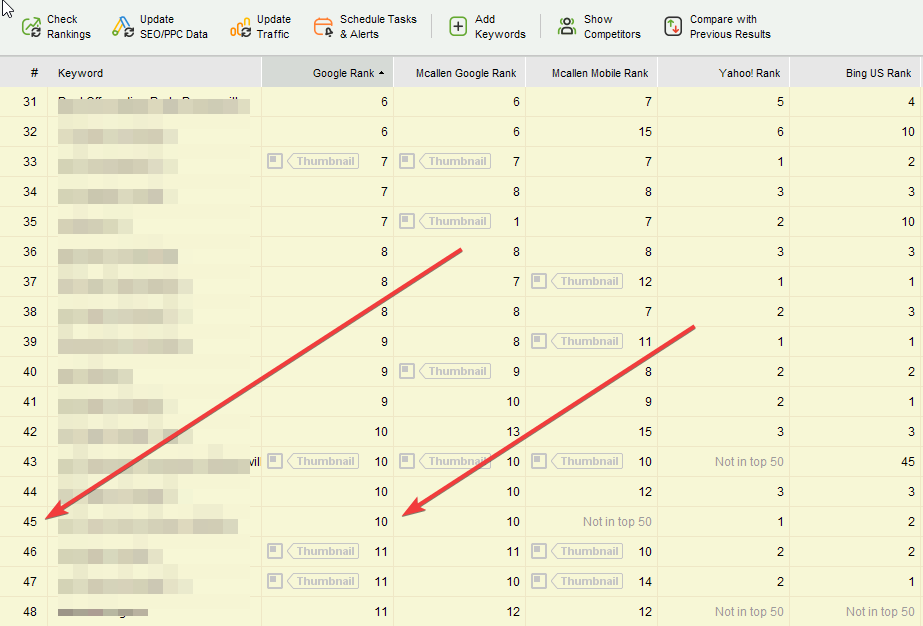
We have 45 keywords in the 1-10 positions in Google.
Site 1
Impressions
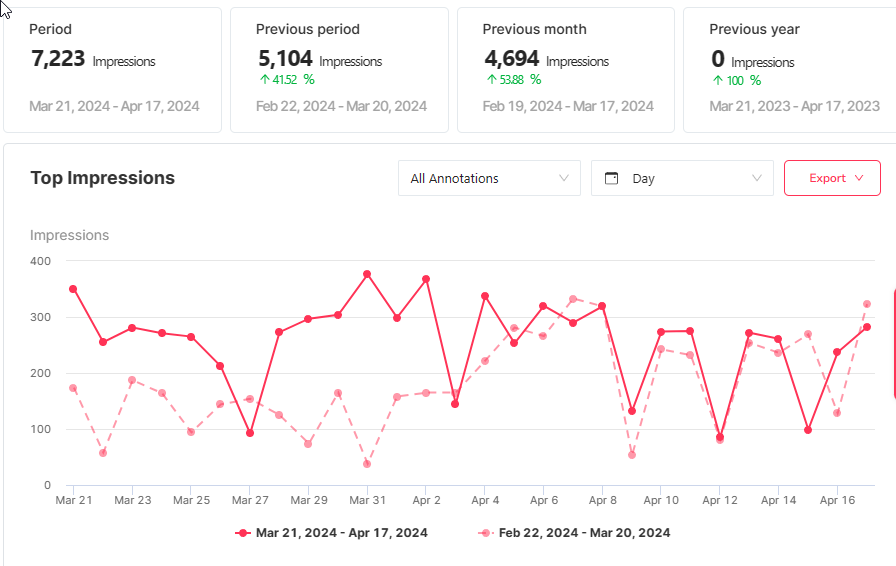
Average Search Position
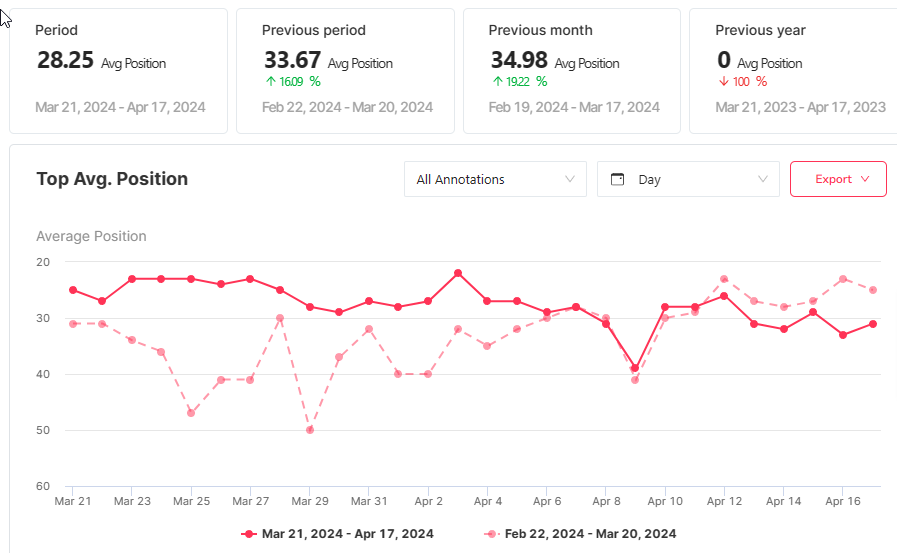
Site Two
Impressions
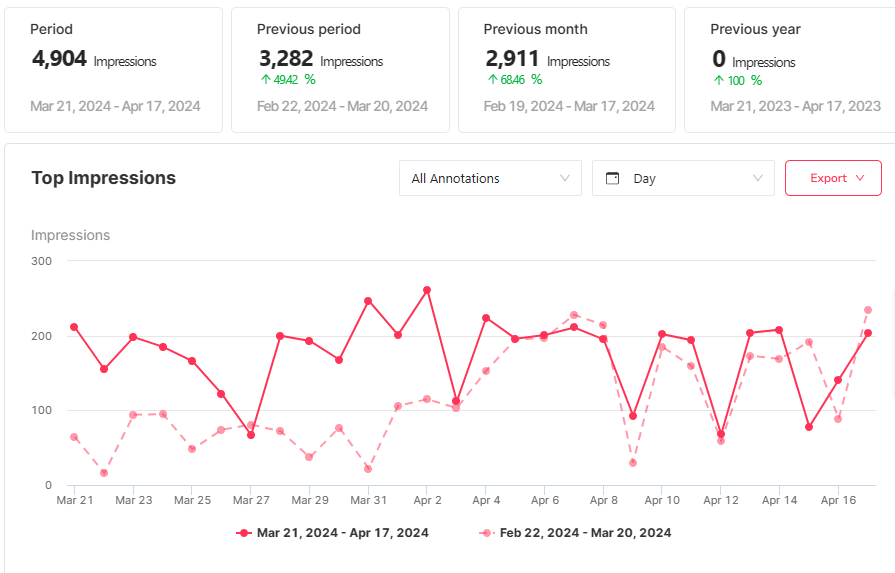
Average Search Position
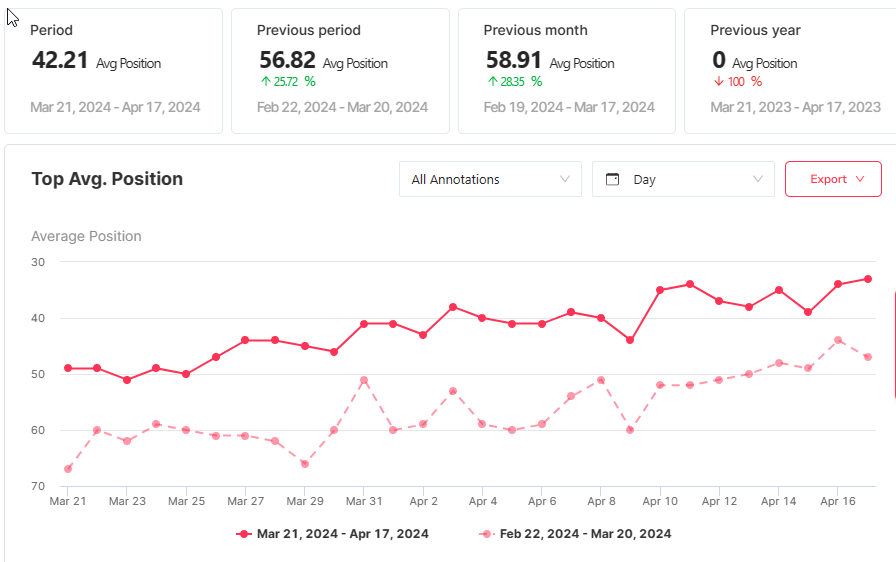
Site Three
Impressions
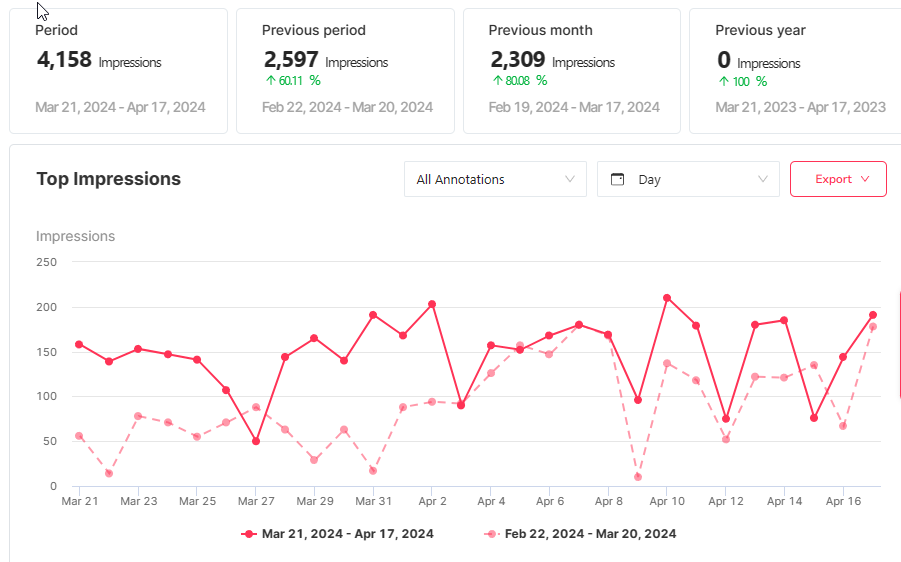
Average Search Position
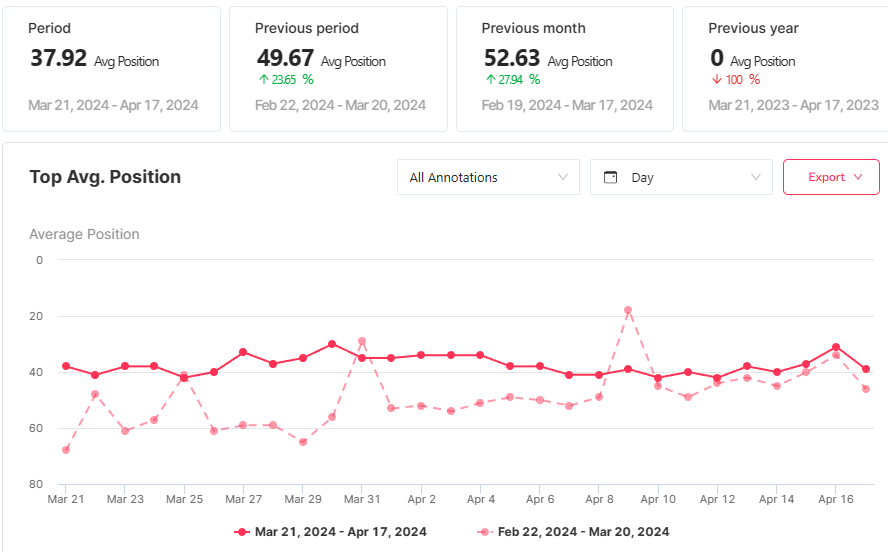
Hello,
How did you monetize these websites? Can you share the volume of calls generated form them?
We did it a little different on these, because they were really just created for the case study. We convert the leads from these sites, to the customer’s site, basically a great landing page of theirs that starts off by asking their make and model, and taking them straight to the parts or service they need, no BS email of phone form, the real thing. These are all high ticket options, and we get a commission based on sales.
Monetization is being handled though a number of conversion systems. Video, redirects, exit pops, banners etc.